Most of us in Master Data Management (MDM) are very familiar with the Dimensions of Data Quality, which are very well explained by David Loshin in his Master Data Management book, or by Thomas Ravn and Martin Høedholt in their very informative article in the Information Management Magazine (see References at the end of this posting for more details).
From the sources above and others, the data quality dimensions normally include, but are not limited to, the following: Accuracy, Completeness, Consistency, Currency, Referential Integrity, Timeliness, Uniqueness, and Validity. Please refer to the references for definitions, or add a comment if you would like me to expand some more on the subject.
I am a big proponent of Data Quality Dimensions, and have used them extensively to help organize and classify the multitude of metrics I have implemented so far. But I also like to organize my data quality initiatives using a complementary view. I like to call it the Quadrant for Data Quality Initiatives.
Data Quality initiatives normally fall into 2 categories: pro-active or reactive. In general terms, pro-active initiatives are measures you establish to avoid problems from happening, while reactive initiatives are measures you adopt after the problem has already occurred and needs correction.
Either of those initiatives can lead to 2 results. One of the results is of Full Compliance, meaning the entire problematic data set is corrected, and risk of bad quality data left is near zero. The second result is of Partial Compliance, where there is no guarantee the problem is fully fixed.
A classic example of a Pro-active/Full Compliance activity is when we establish referential integrity rules to avoid incorrect data from being added to the system. In my opinion, that is the ideal scenario. If we could only establish those types of rules for every data element, our life would be much easier. Unfortunately, that's not the case. We can't possibly prevent all data errors from happening.
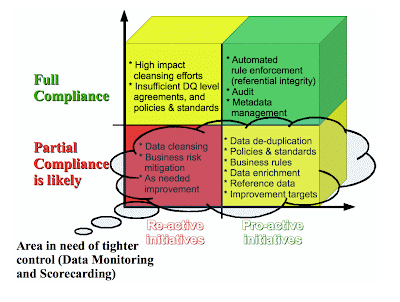
That's when the Quadrant comes handy. You can define your data quality initiatives in the terms describe above, and place them as appropriate in the quadrant. The next diagram shows a possible classification:
Figure 1 - Quadrant with Data Quality Initiatives
The usefulness of the Quadrant comes from the fact that you can easily identify which initiatives require closer attention. If a certain initiative leads to Partial Compliance, that means you need to establish control mechanisms to track the progress and mitigate the impact and risk of the bad data quality still in place. On the other hand, if you know for sure an initiative will achieve Full Compliance, the need for control is lower.
You can also look at the Quadrant from an opposite direction. You can put as much emphasis on a specific initiative as needed to achieve as much compliance as required. In my diagram, you'll notice I have data cleansing as a reactive initiative leading to 2 results: full and partial compliances. I call one of them Data Cleansing and the other High Impact Cleansing Efforts. The difference comes from the desired outcome. If a “perfect” outcome is required, more attention and resources need to be put during the cleansing activity itself. If not, less attention and resources are required, and the monitoring comes from the overall on-going data quality controlling activities.
The next diagram adds the area where more control is needed. By control, I mean data monitors and data quality scorecards. Those controls are established within the parameters of the Data Quality Dimensions, and that is how you can bring both techniques together.
Figure 2 - Quadrant with Data Quality Initiatives and Where to Focus Control
As a final note, some of the initiatives I have above could be different or placed elsewhere in the quadrant based on your environment conditions and requirements.
References:
Loshin, David: Master Data Management – Copyright © 2009 by Elsevier Inc.
Ravn, Thomas; Høedholt, Martin: How to Measure and Monitor the Quality of Master Data – Information Management Magazine, May 2009


A good post very interesting
ReplyDeleteAlexander,
ReplyDeleteThanks a lot for your comments. Please make sure you check this posting and others at my new web site at http://www.dcervo.com
Thanks,
Dalton.